Bitcoin market cycles follow a recurring four-year structural pattern of accumulation, markup, distribution, and markdown, dictated by programmatic protocol mechanisms and shifting participant behavior. Accurately pinpointing an asset’s position within this macro market structure requires advanced on-chain metrics that transcend purely theoretical frameworks. Quantitative tools such as the Accumulation-Distribution Cycle Index and the Repetition Fractal Cycle map real investor behavior and temporal patterns onto mathematical models. Furthermore, evaluating the evolving cost bases of short- and long-term holders through the True Market Mean Price and the STH-LTH Market Signal provides institutional analysts with a definitive diagnostic dashboard to identify trend strength, demand exhaustion, and primary cycle transitions.
Market Cycle Structure
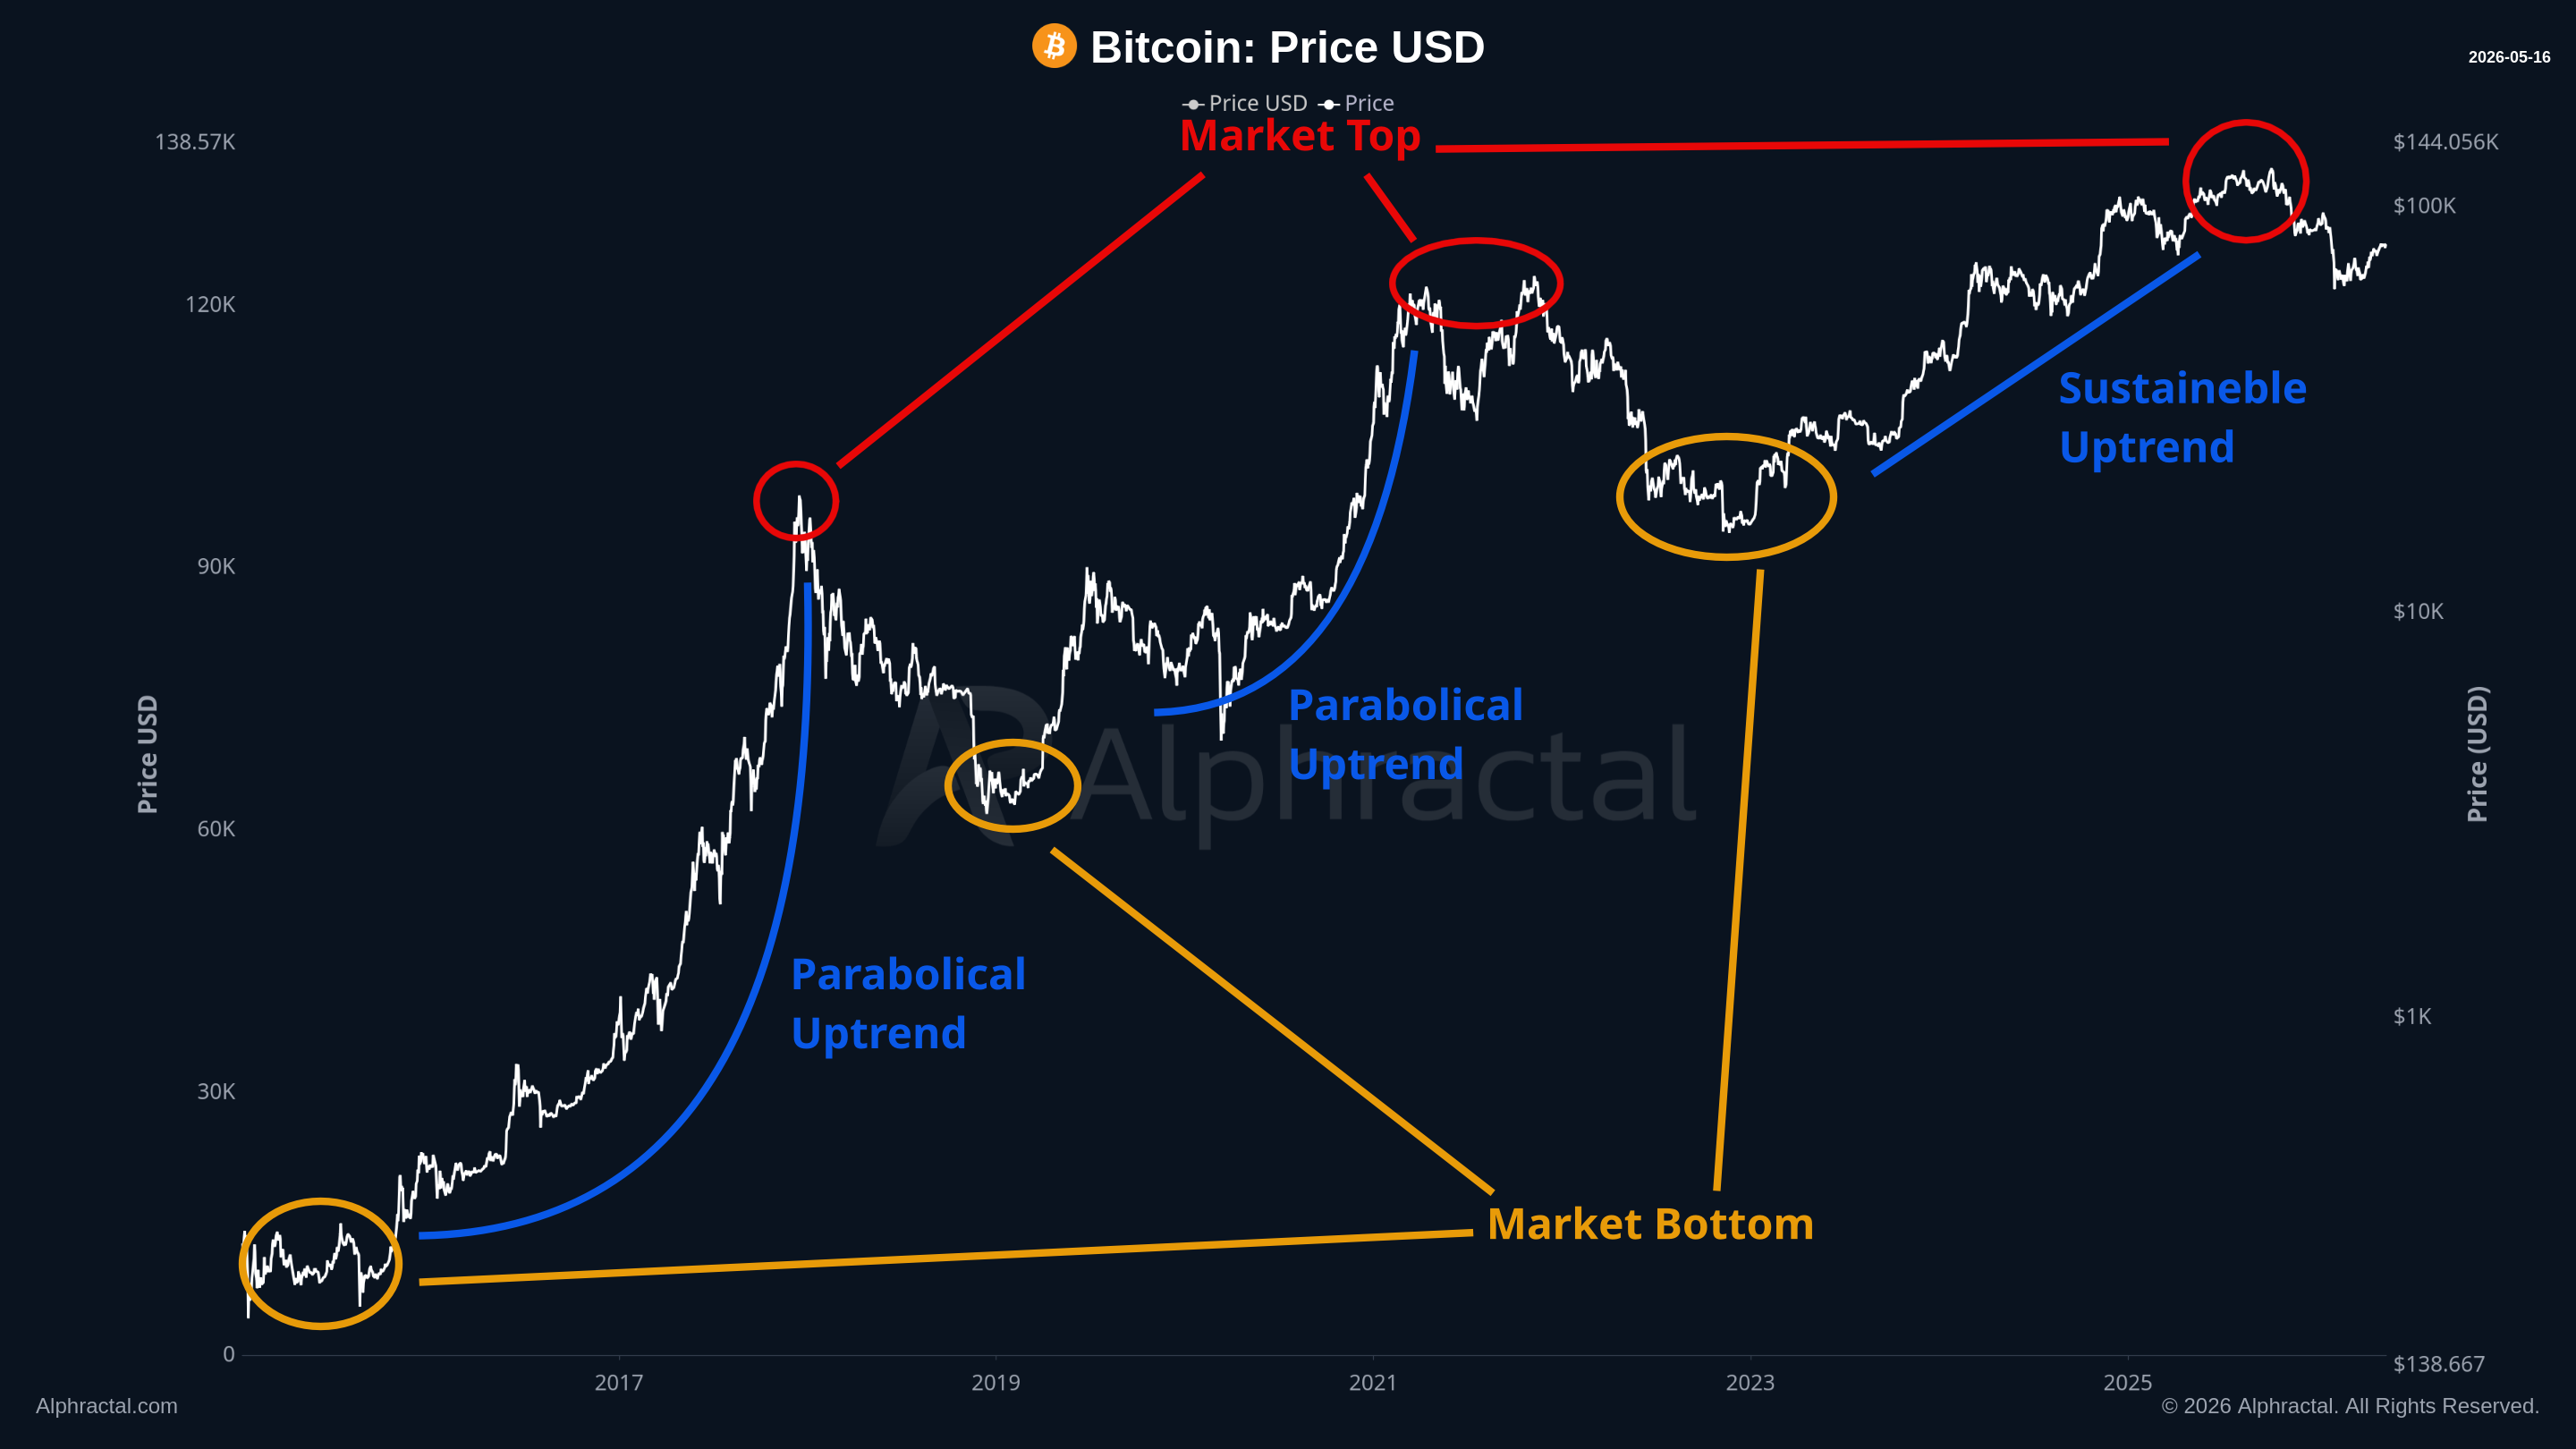
Understanding financial markets requires grasping a fundamental heuristic known as market cycles. These cycles consist of a repeating structural pattern of expansion, peak, contraction, and bottom, forming a continuous loop of capital allocation and destruction. From a price-action perspective, this dynamic divides an asset’s trajectory into four primary phases:
- The markup phase, or bull market, represents an upward price trend. Natural corrective intervals occur during this process. When incoming capital has strong conviction and low institutional fragility, these corrections manifest as sideways price consolidation.
- The top, or distribution phase, marks the exact point where the uptrend reverses. If this peak is formed by parabolic acceleration, the structure reveals significant directional fragility, leading to an abrupt reversal. Conversely, a top formed by a prolonged sideways price consolidation indicates a sustainable uptrend, proving that market participants are not driven by Fear of Missing Out (FOMO).
- The markdown phase, or bear market, encompasses the downward price trend. This phase also features temporary upward moves, known as rallies. Much like the uptrend phase, declines devoid of structural panic result in temporary sideways consolidation rather than vertical crashes.
- The market bottom, or accumulation phase, establishes a prolonged period of consolidation over an extended timeframe, during which the asset is transferred from impatient traders to long-term holders.
Participants respond to liquidity incentives and shifts in perceived value, creating waves of adoption and exhaustion that are directly reflected on the price chart.
In the Bitcoin ecosystem, these cycles historically last approximately four years. This periodicity stems partly from the algorithmic mechanisms embedded in its protocol—specifically the halving event, which reduces the issuance of new supply and alters mining costs. The chronological sequence of Bitcoin’s recent cycles perfectly illustrates these structural variations:
- 2017: A parabolic uptrend culminating in an extremely fragile blow-off top.
- 2020 and 2021: Sequential parabolic uptrends resulting in fragile tops.
- 2023 and 2024: A sustainable uptrend characterized by a less volatile top with sideways price distribution.
While these theoretical structures are well-recognized, pinpointing the price’s exact position within the current cycle requires precise quantitative tools, which justifies the use of advanced on-chain metrics.
Accumulation-Distribution Cycle Index
The Accumulation-Distribution Cycle Index is a proprietary metric developed by Alphractal to segment the Bitcoin cycle into the four theoretical phases of the Wyckoff model: Accumulation, Markup, Distribution, and Markdown. By processing live blockchain network data, this indicator evaluates actual investor behavior and maps their actions onto an oscillator ranging from 0 to 100. The indicator’s readings are divided into the following structural zones:
- Readings above 70: Represent the Distribution phase.
- Readings between 30 and 70: Represent transitional markup or markdown periods.
- Readings below 30: Represent the Accumulation phase.
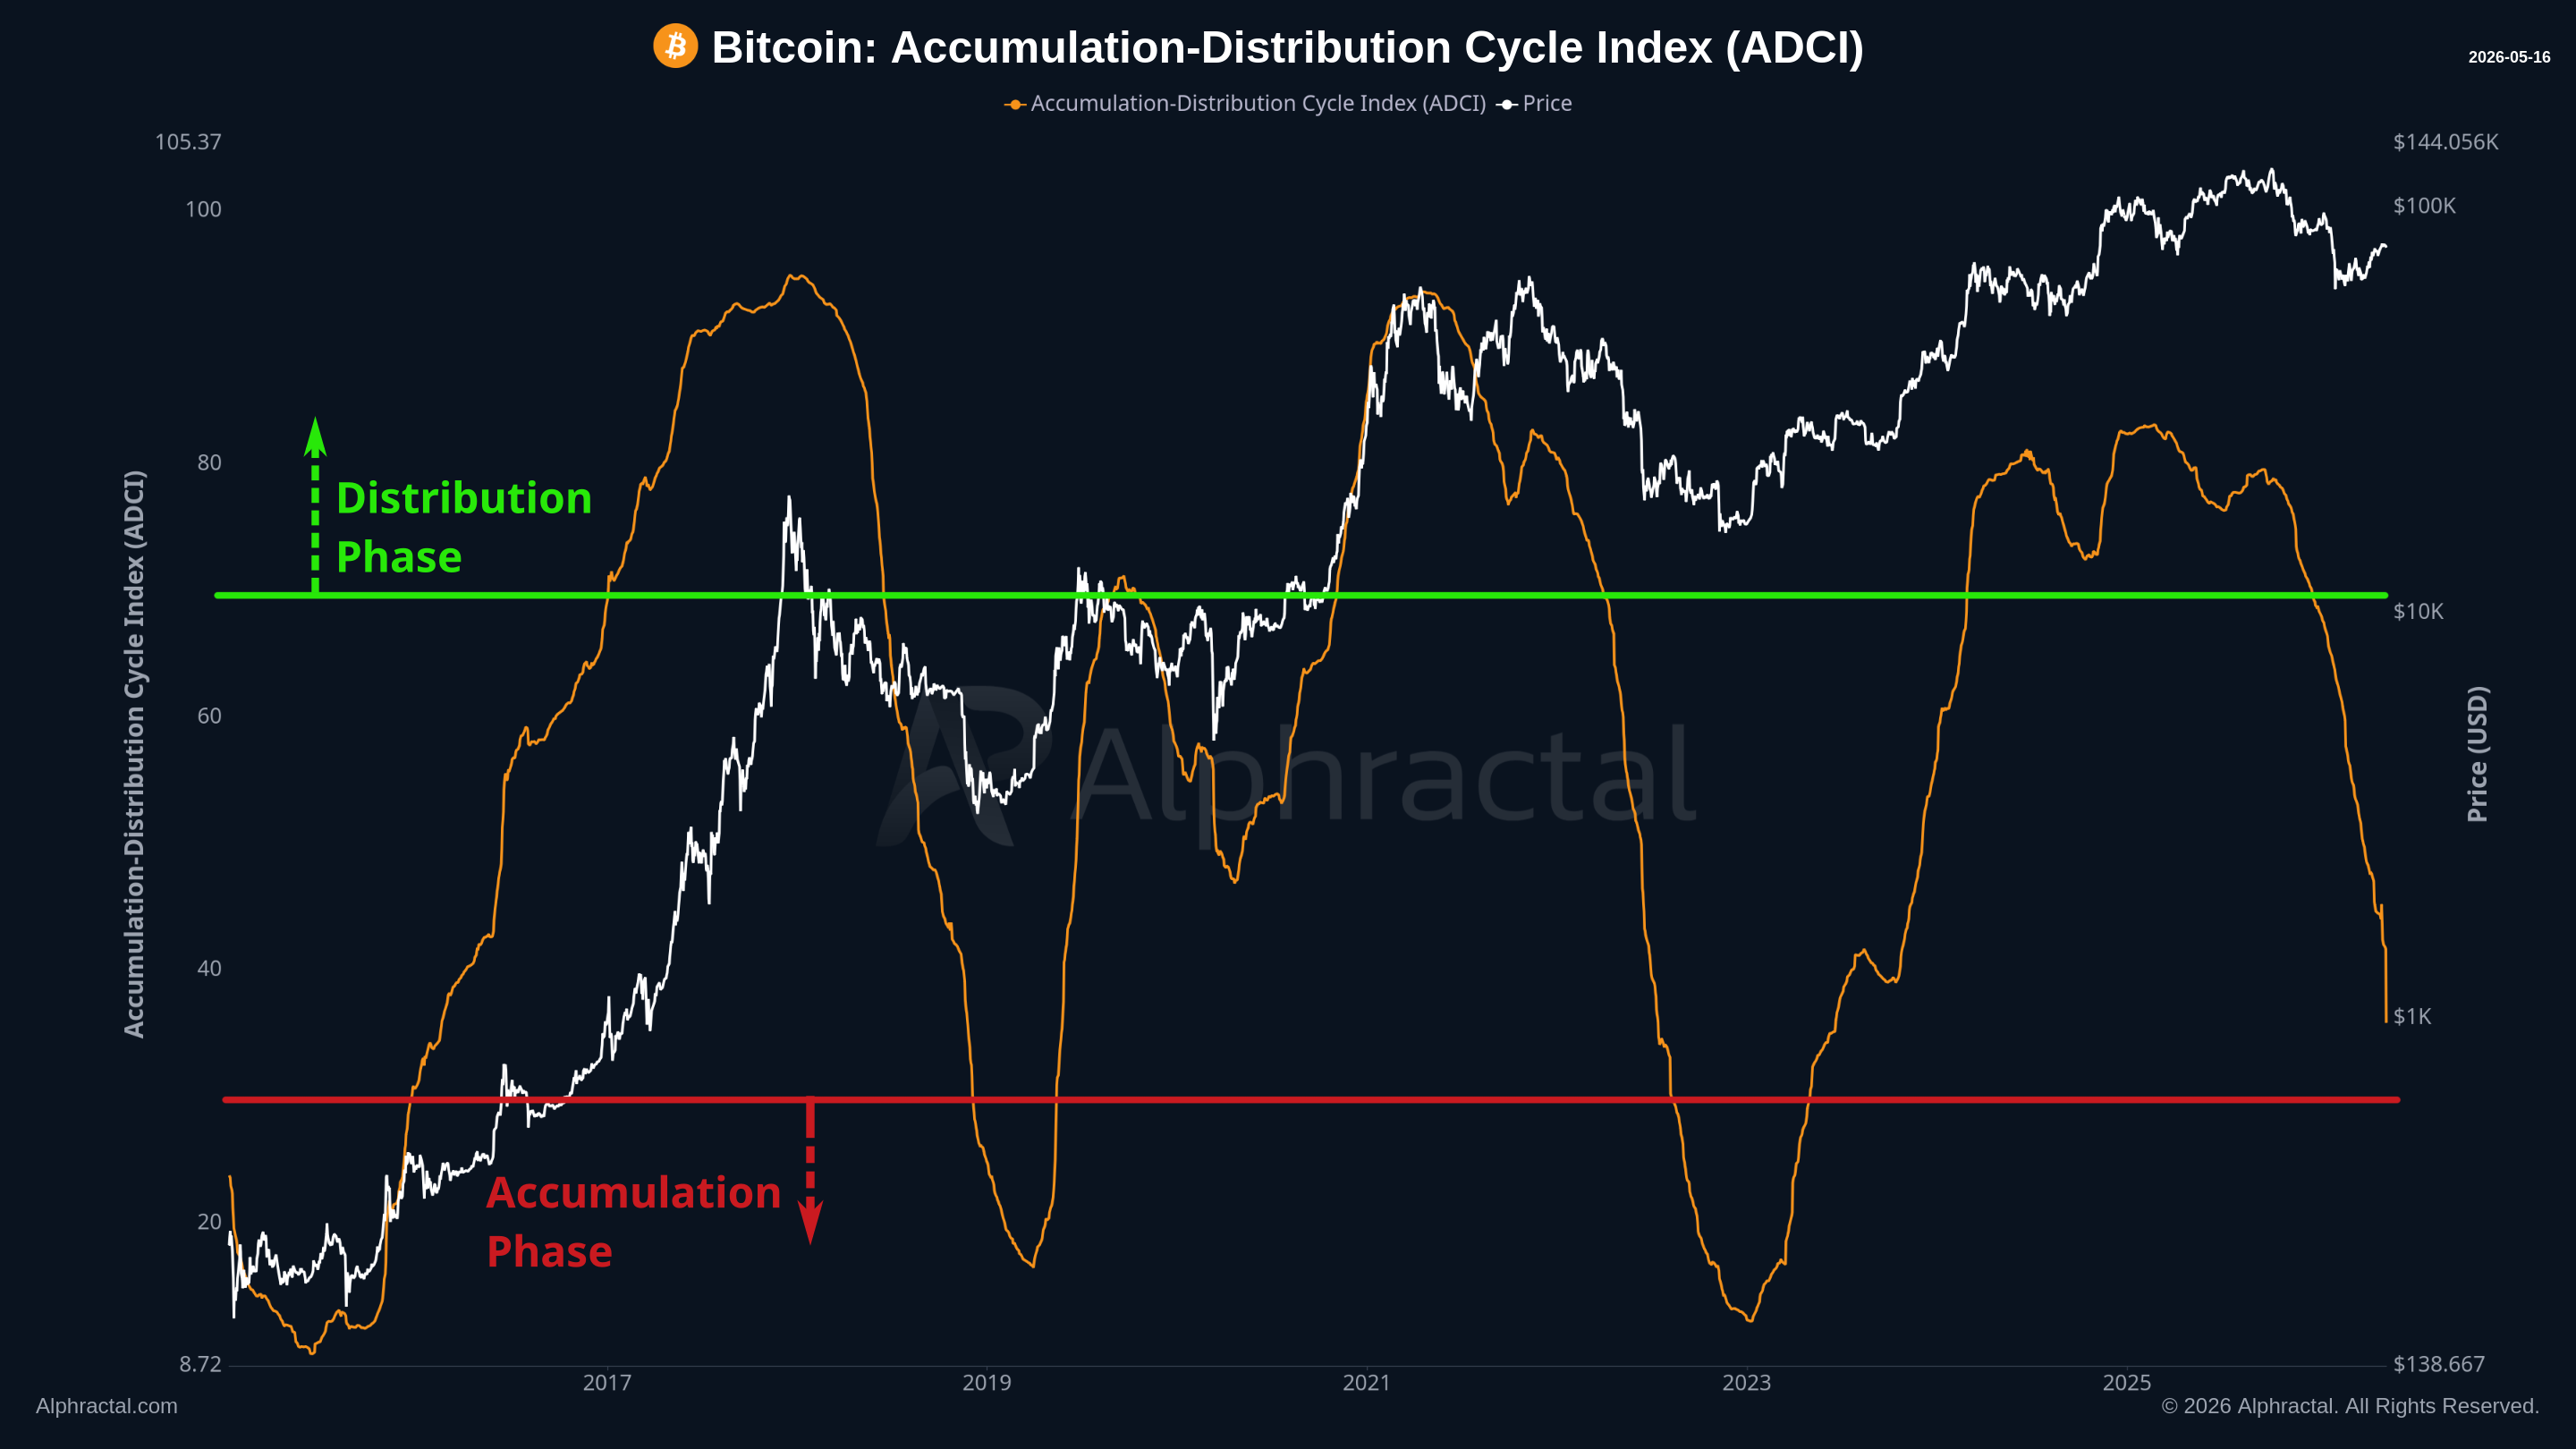
The direction of the index’s curve confirms the underlying bullish or bearish trend. Historical analysis shows that parabolic uptrends do not allow for sideways price distribution, as coins are distributed rapidly during violent price surges. Sustainable uptrends, however, enable methodical distribution accompanied by extended sideways price consolidation. The peak readings of this metric signal total market exhaustion. Meanwhile, the accumulation zone confirms steady coin absorption through highly consistent sideways price consolidation.
Repetition Fractal Cycle
The Repetition Fractal Cycle is a proprietary Alphractal metric designed to track temporal patterns. It demonstrates that the Bitcoin-to-USD pair, along with its total market capitalization, follows a roughly four-year cyclical pattern with mathematical precision. This pattern has maintained high consistency since 2015, reliably predicting market tops and bottoms. Typically, the asset undergoes an accumulation phase lasting about a year, followed by a markup phase where appreciation begins. By the third year following the previous cycle’s bottom, Bitcoin generally establishes a new all-time high.
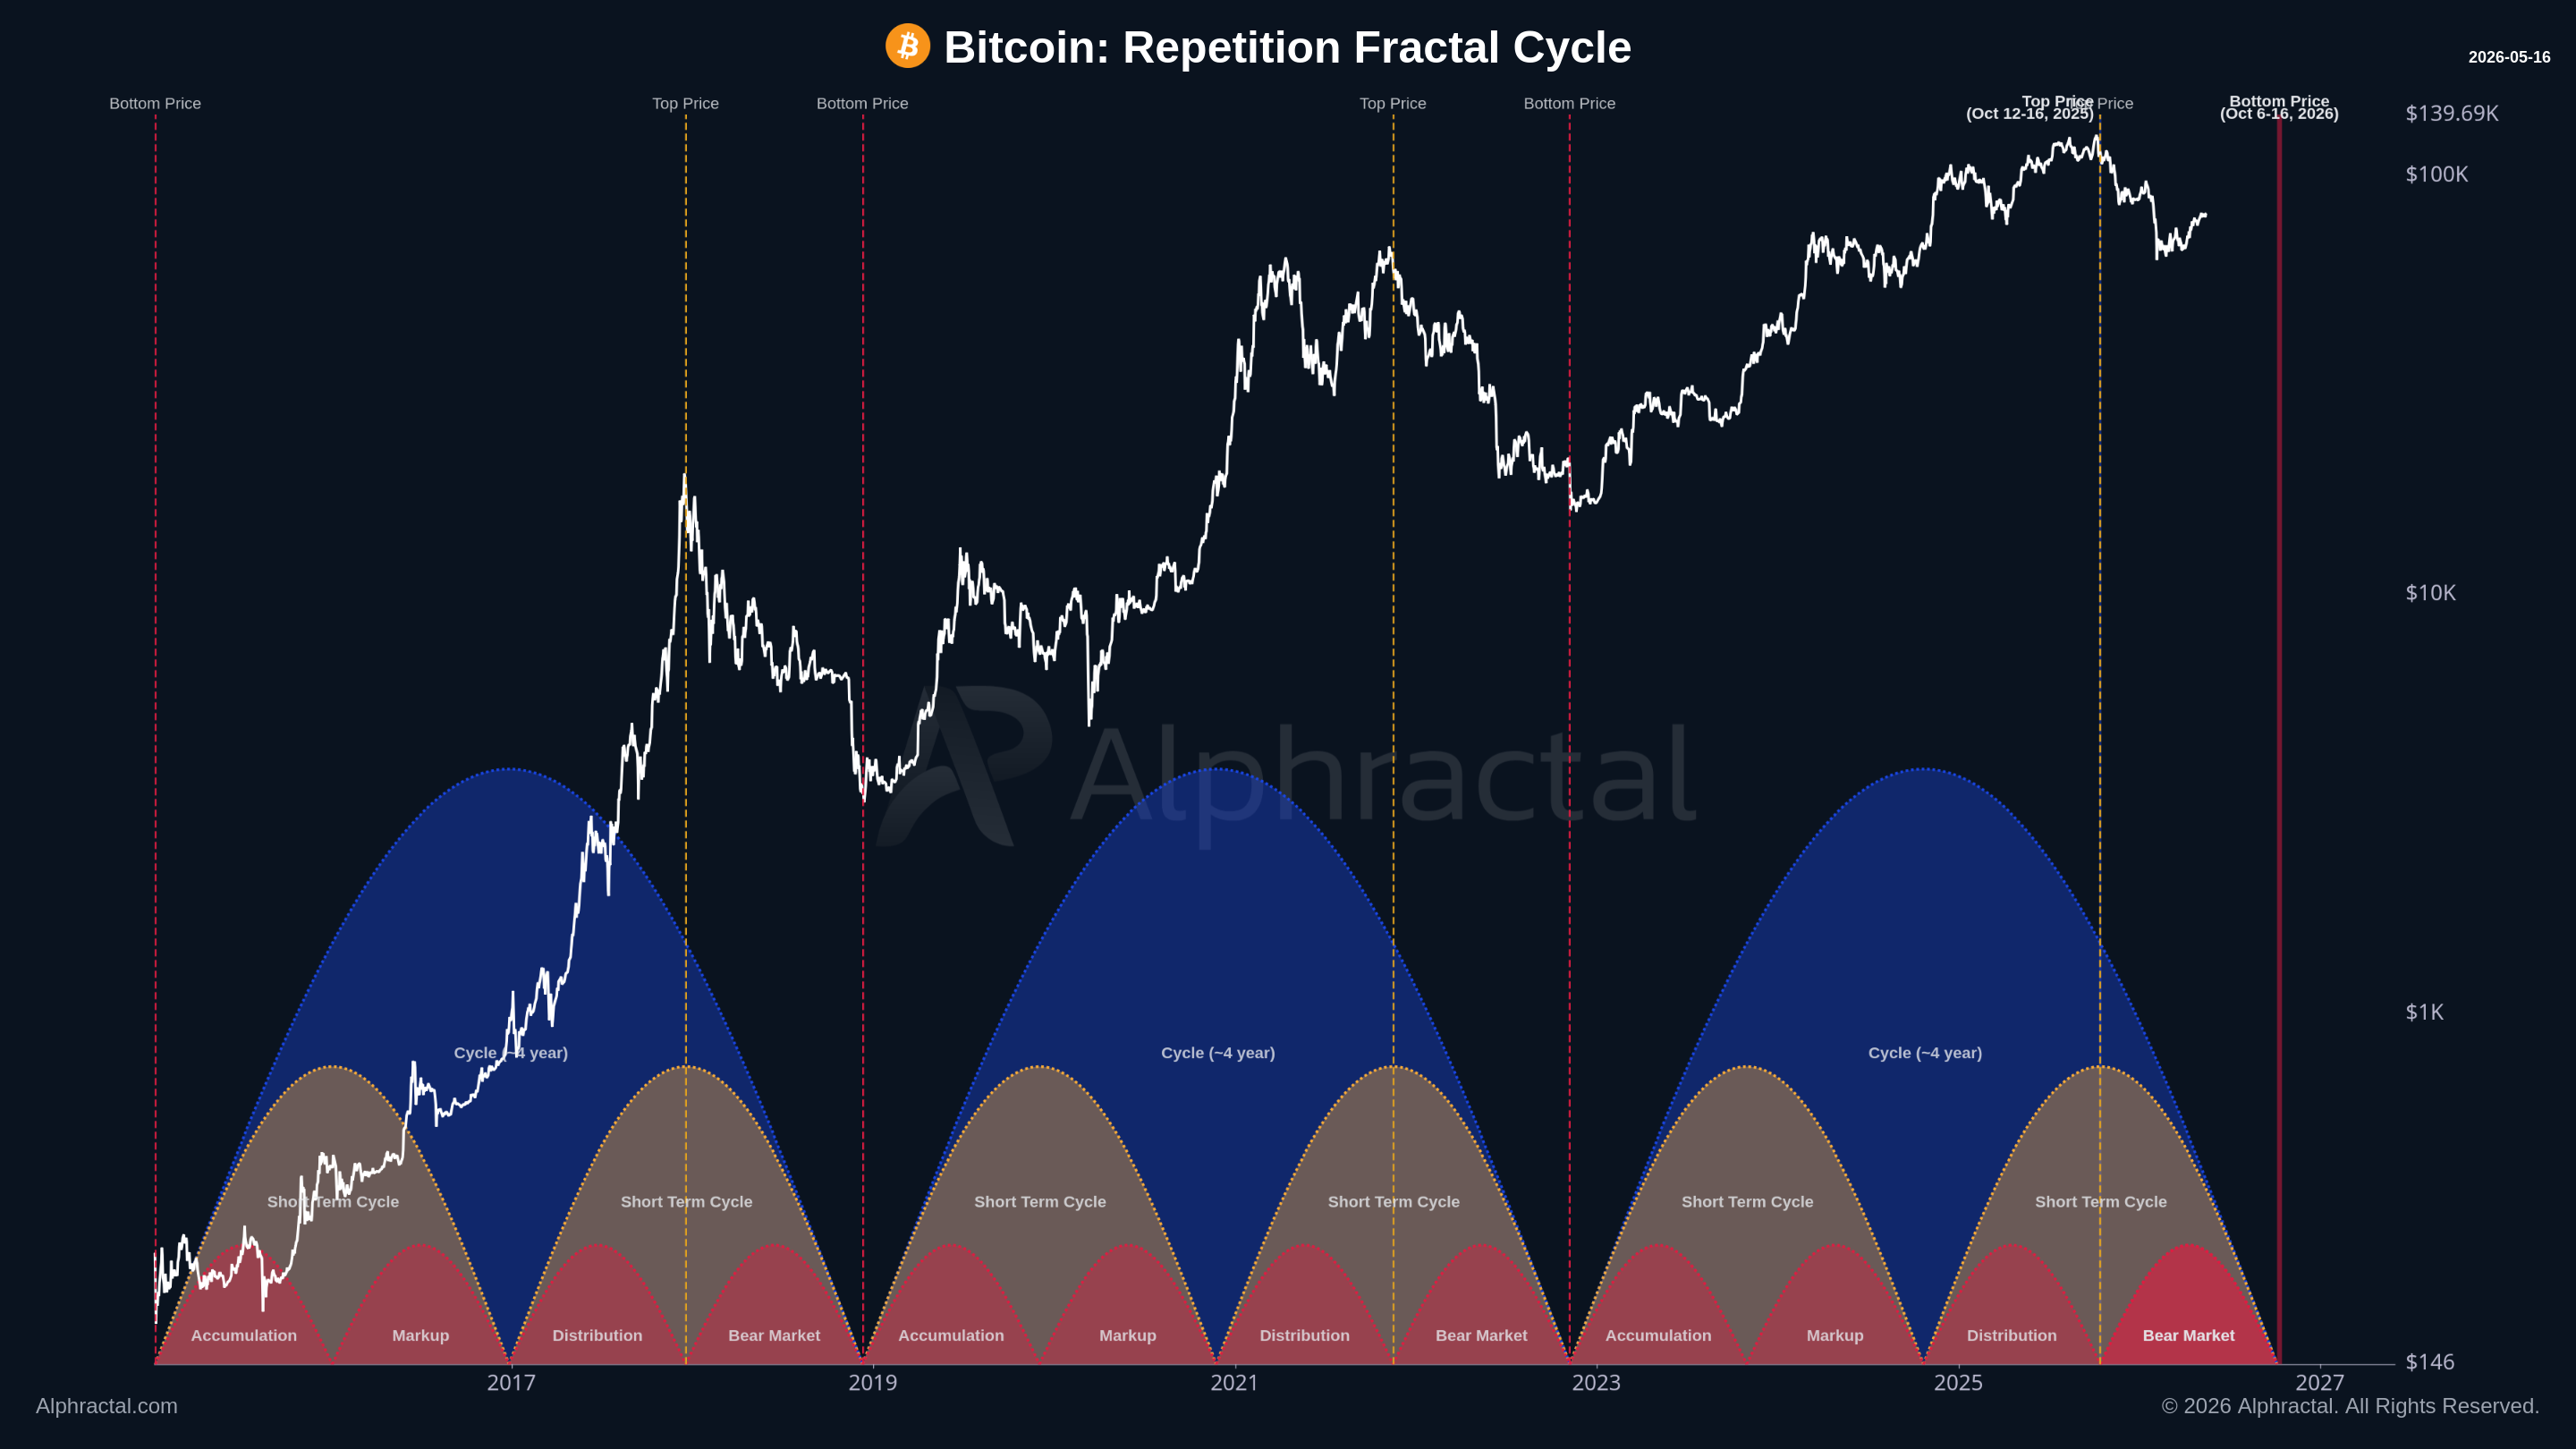
Price action follows a structure rooted in strict mathematical fractals. This fractal concept applies Wyckoff’s pattern theory by repeating its core structure across different scales, meaning the same structural pattern appears within larger patterns across various timeframes. This quantitative metric serves as a directional tool and should be integrated into a comprehensive diagnostic dashboard alongside macroeconomic analysis and on-chain network data.
True Market Mean Price and Trend Dynamics
The True Market Mean Price represents the average acquisition cost of coins actively traded on secondary markets. The formula explicitly excludes inactive supply held by miners, calculating the metric by dividing the Investor Cap (investor capitalization) by the Active Supply (the supply of active coins). This establishes the cost basis for investors who are economically engaged in the asset’s price discovery.
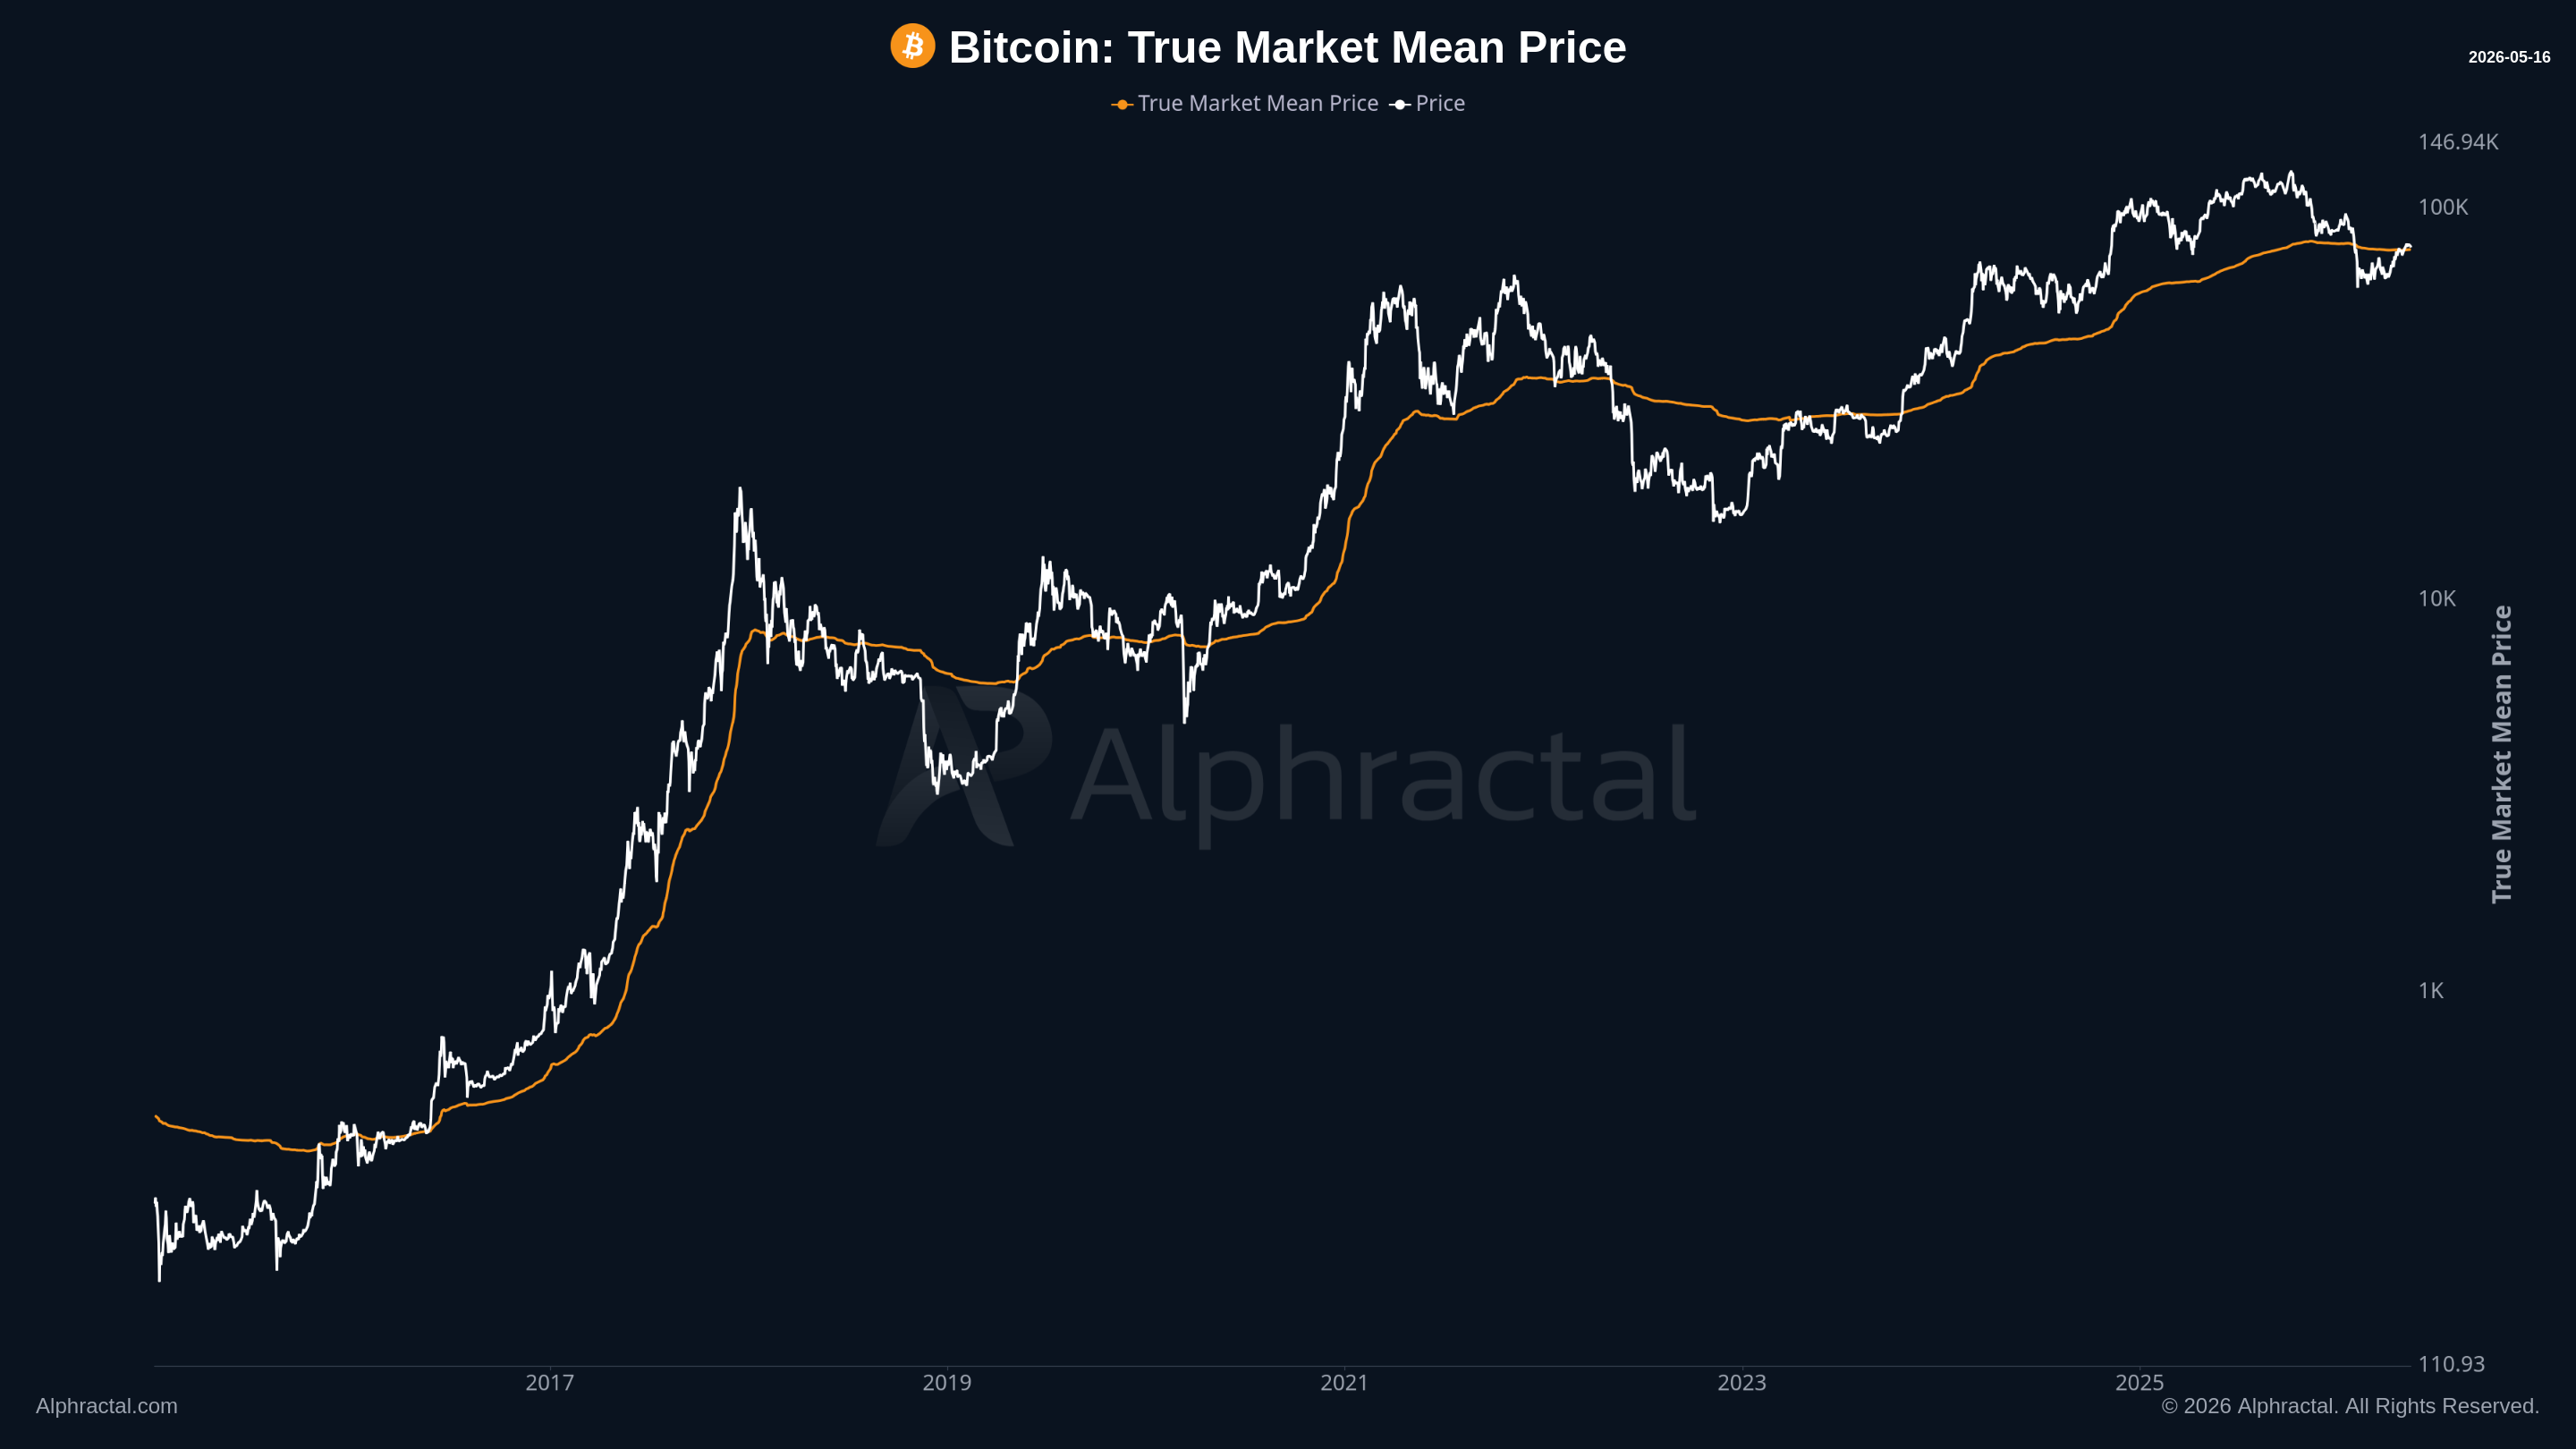
This indicator serves as a long-term trend benchmark, functioning similarly to an extended simple moving average. When the market price remains above the True Market Mean Price, it confirms an active bull market. Conversely, when the price falls below this line, it signals a bear market.
To extract a highly sensitive trend signal, institutional analysts incorporate the Short-Term Holder Realized Price. This metric represents the average acquisition price of Bitcoin held by short-term investors (defined as those holding coins for fewer than 155 days). This cohort reflects the most reactive, momentum-driven market participants, and the metric functions much like a short-term simple moving average.
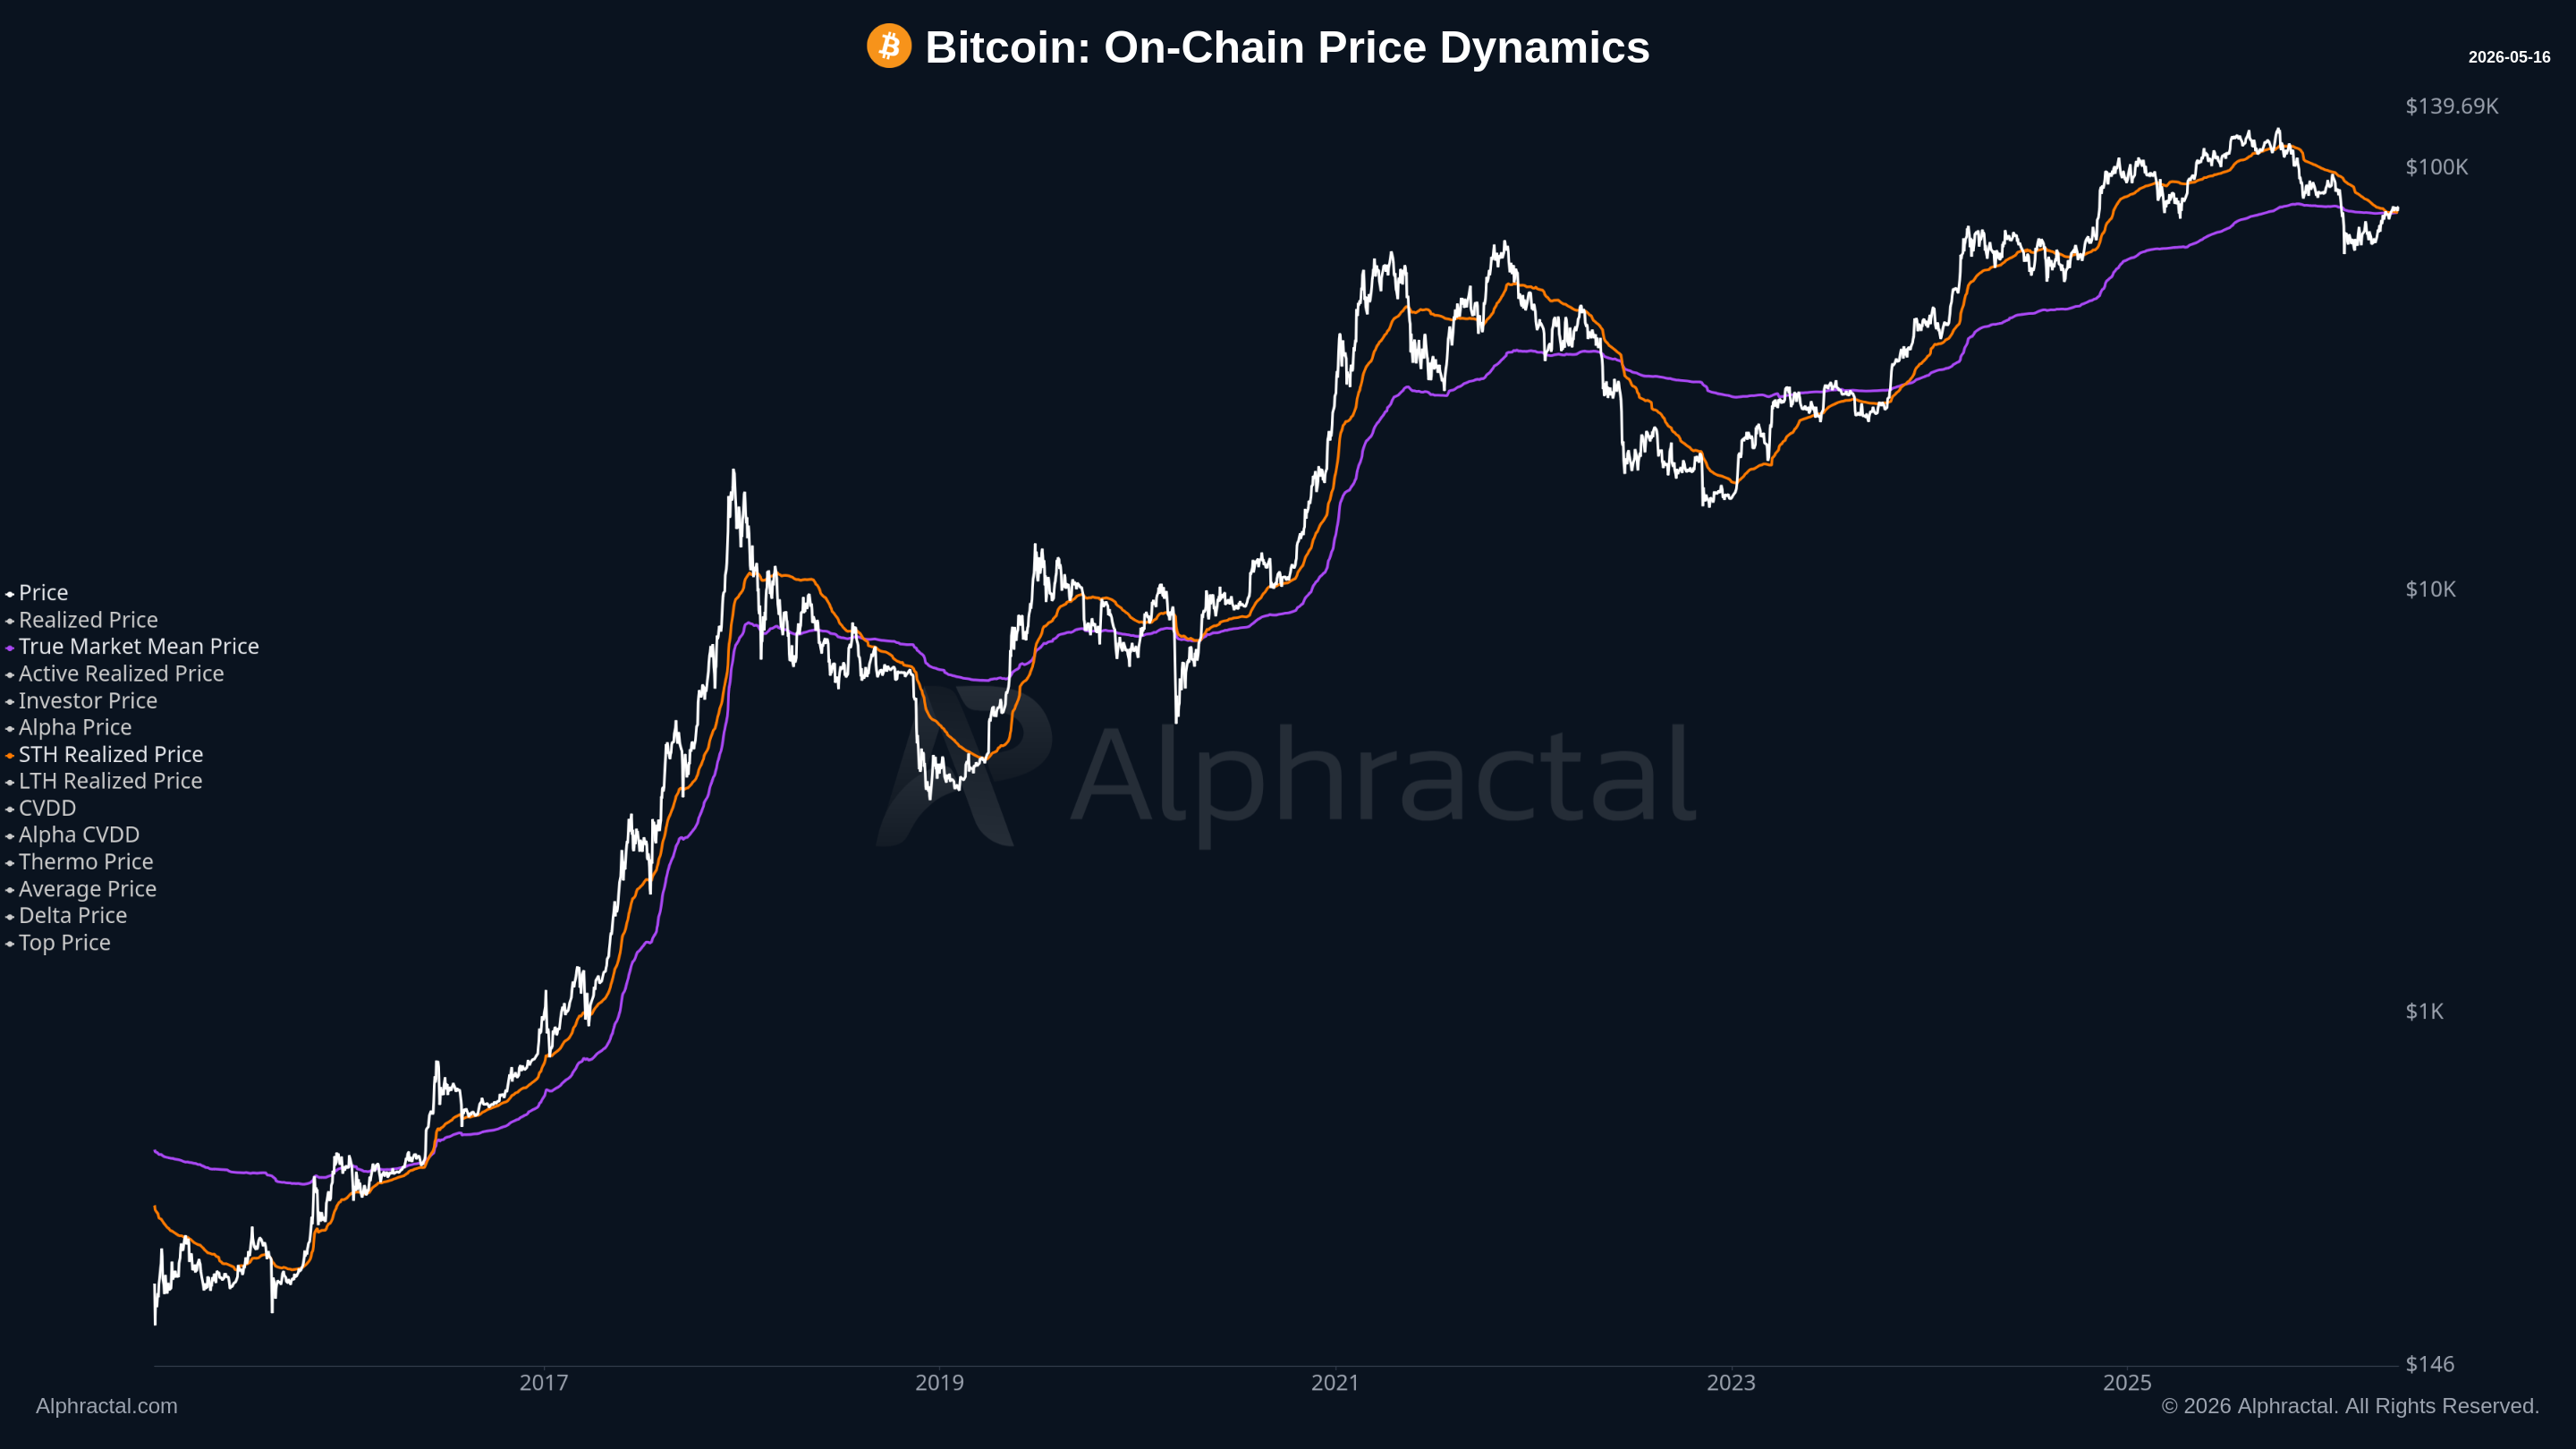
A bullish crossover, where the Short-Term Holder Realized Price breaks above the True Market Mean Price, confirms strong momentum within the ongoing uptrend. A bearish crossover, where the Short-Term Holder Realized Price drops below the True Market Mean Price, signals demand exhaustion and intensifying sell pressure. This mathematical shift indicates that recent capital is being allocated at a lower cost than the active historical baseline, confirming structural market weakness and an accelerating downtrend.
STH-LTH Market Signal and Cycle Transitions
The STH-LTH Market Signal is a quantitative dashboard that compares the Short-Term Holder Realized Price against the Long-Term Holder Realized Price. The Long-Term Holder Realized Price establishes the cost basis for long-term investors who exhibit high resilience to price volatility. The system automatically detects crossovers between these two cost baselines, generating definitive signals for major market cycle transitions.
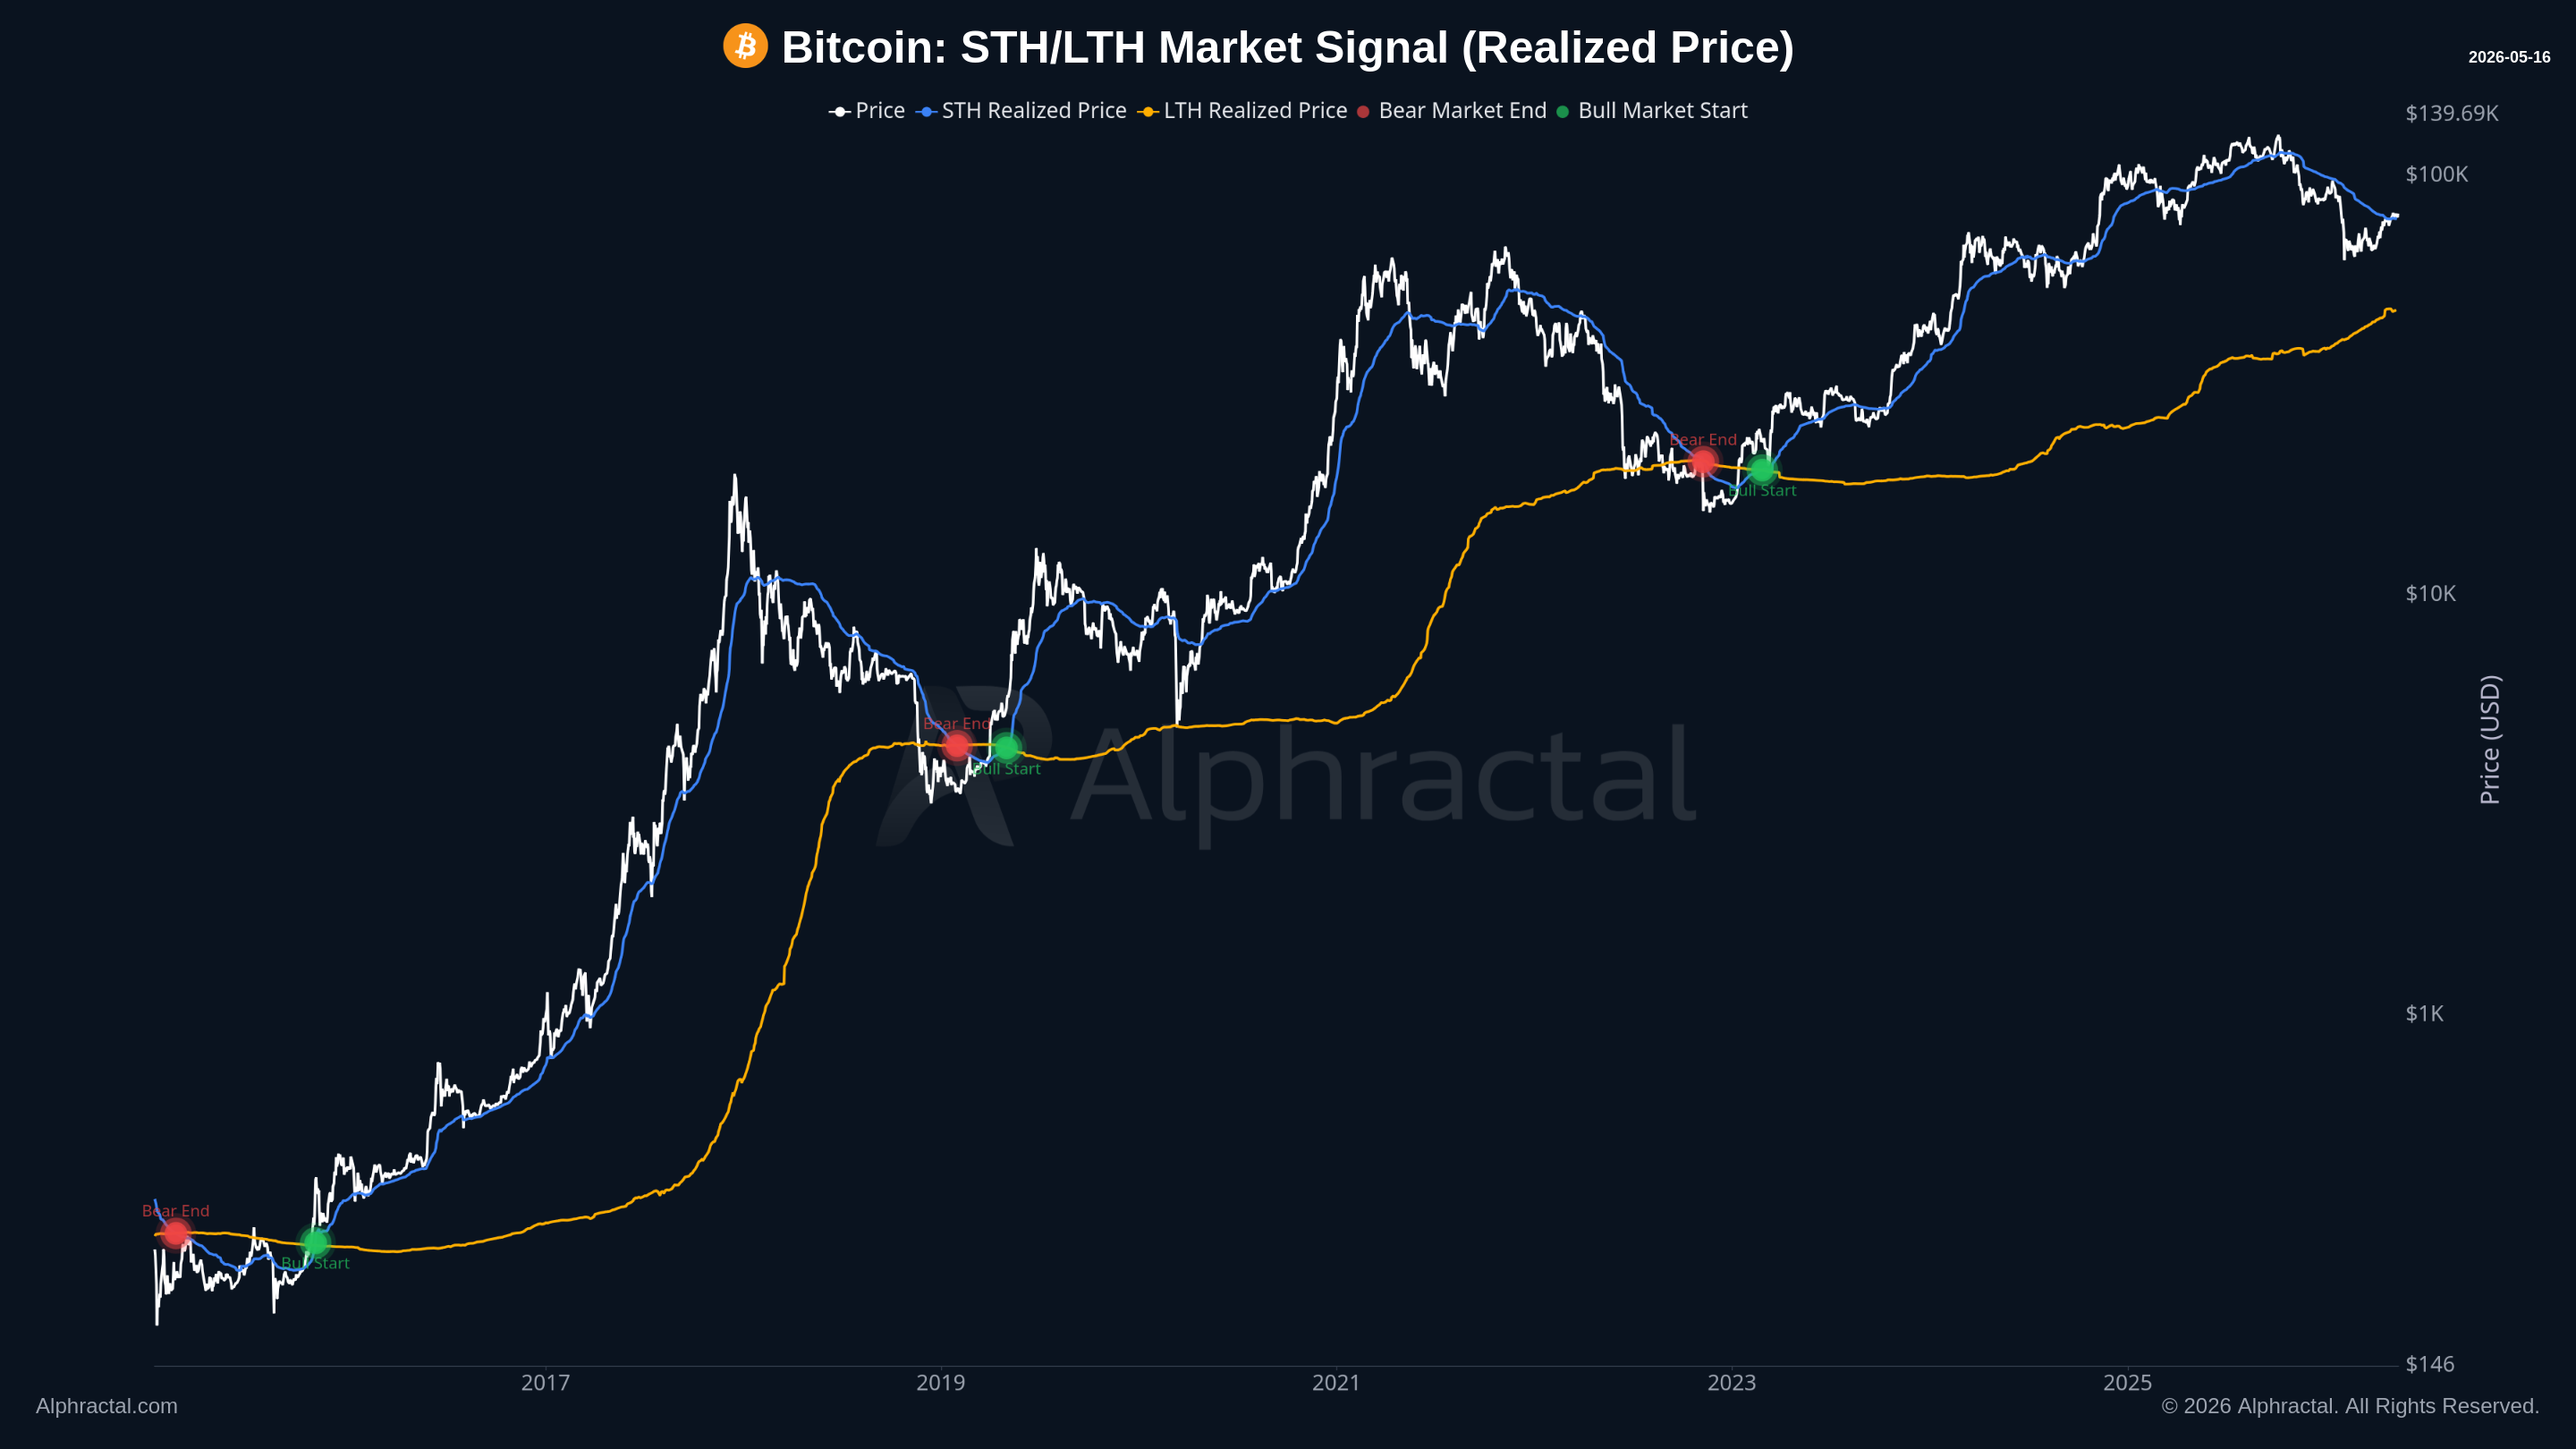
The platform issues precise signals based on these cost-basis dynamics. A bear market bottom is confirmed when the short-term holder cost line crosses below the long-term holder cost line. This mathematical event indicates that the cost basis of newer investors has dropped below that of resilient capital, signaling that the market has hit its absolute floor and has formally entered the accumulation phase.
Conversely, the start of a bull market is triggered when the short-term holder cost line crosses above the long-term holder cost baseline. This event proves that aggressive new capital is entering the system, sustaining progressively higher acquisition costs and driving structural price appreciation. Analyzing these lines together provides traders with clear context of the market’s macro structure and early identification of cycle shifts.
Also posted as a thread on Alphractal’s X.